

Profiler provides you with a variety of tools to help you extract compound data from your spectra. The data extraction process, called profiling, includes selecting compounds from your Library, setting concentrations, determining peak locations, and finding and using extended information about compounds that you would like to profile.
The Compound Table summarizes the results of your profiling work with the current spectrum. It contains entries for compounds that are available to profile in your spectrum, as well as those that you have already profiled, along with their maximum and profiled concentrations. You can modify the display of the Compound Table to show as much or as little information as you like, to better suit your preferred approach to profiling.
The currently selected compound in the Compound Table is the active compound in the Spectrum Graph, where you can adjust its shape, position, and concentration.
You can filter the current contents of the Compound Table using Quick Searches for compound names, comments, compound IDs, regions of the spectrum, or specific locations in the spectrum.
Using the Compound Table, you can set custom display colors for compounds, pin compounds so that they are visible even when they are not selected and toggle stars on compounds to generally mark them for future reference.
You can select more than one compound from the Compound Table by holding down Ctrl (Cmd in Mac OS X) and clicking additional compounds. If you would like to select a range of compounds, click on the first compound and then hold down Ctrl-Shift (Cmd-Shift in Mac OS X) and click on the last compound. This form of multiple selection will allow you to apply colors, pins, or stars to multiple compounds simultaneously.
There are many columns available for display in the Compound Table. You can choose to display any number of the available columns, with a minimum of one visible at any time, and you can drag the column headers to position the columns in any order that you like. You can sort the Compound Table on any column by clicking its column header. Click the header again to reverse the sort order.
Tips and Tricks
-
You must select at least one compound set in the Compound Sets view to see any compounds in the Compound Table.
-
When you have nothing selected in the Compound Table, pressing the up or down arrow keys will select the first compound in the Compound Table.
-
After typing in the Quick Search box, press the down arrow key to navigate to the Compound Table.
-
When you select a compound without a concentration in the Compound Table, a preview line for the compound appears in the Spectrum Graph, scaled vertically to suit your current zoom level. You can click on the preview line to begin profiling that compound; its concentration will be set to match the height of the preview line.
-
When you select a compound with an icon in the Status column, the status area to the left of the Quick Search box shows a detailed status message. You can also see the detailed status message in the tooltip that appers when you hover the mouse cursor over the status icon.
-
When you hover the mouse cursor over some parts of the Compound Table, tooltips appear containing more details. For example, hovering over the optional matched clusters column for a compound shows you which clusters are matched.
-
You can set compound concentrations directly in the Compound Table, by double-clicking on a compound's concentration cell and typing in a value.
-
You can perform many common compound operations through the context menu, available by right-clicking on a compound's row in the table. Operations accessible through the context menu include scaling concentrations, automatically fitting the compound to the spectrum, and clearing fits, custom colors, stars or pins.
-
You can copy the contents of a cell to the Clipboard by right-clicking on the cell and selecting Copy [cell name] to Clipboard. You can then paste the contents as text to any other program.
-
Compounds that you have modified from their default state (including fits, custom colors, pins and stars) will appear in the Profiled Compounds set, and appear in bold in the Compound Table.
-
Press Delete with one or more compounds selected in the Compound Table to clear all fits, custom colors, pins and stars for the selected compounds.
-
To make more space for the Compound Table, you can hide the Spectrum Thumbnail by clicking View > Show Spectrum Thumbnail.
Related Topics
When working with multiple compounds, it can become difficult to distinguish which compounds are contributing which parts to an overlapped region. You can set specific compounds to appear in colors of your choice whenever they are visible in the Spectrum View.
| Menu Location | Compound > Assign Color... |
| Icon |
|
How do I set a custom color for one or more compounds?
-
Select one or more compounds in the Compound Table.
-
In the Compound menu, click Assign Color... and select your desired color. Alternatively, if your Compound Table has a Color Column open, click in the Custom Color column (
 ) to access the color chooser.
-
Click one of the preconfigured colors in the color chooser, or click More... to choose from a larger selection of colors.
| Menu Location | Compound > Clear > Color |
| Icon |
|
How do I clear a custom color from one or more compounds?
-
Select one or more compounds in the Compound Table.
-
In the Compound menu, click Clear > Color, or click in the Custom Color column (
) and click Clear Assigned Color.
Tips and Tricks
-
You can also set or clear custom colors for compounds visible in the Legend, by clicking on the colored box beside the compound in the Legend.
-
Setting a custom color for a compound adds it to the Profiled Compounds set, even if you have not fit the compound.
-
Custom colors are stored with the spectrum when you save it as a
.cnxfile. The colors you select are still associated with the compounds when you next open the file, until you clear them. If you want to set the color of a specific compound in a group of.cnxfiles, use the Batch Edit feature. -
You can export custom colors to a file using Batch Export.
It is often useful to display several different compounds at the same time while profiling, especially when you are working in heavily overlapped area. Pinning a compound ensures that it remains visible regardless of which compound you have selected in the Compound Table. In combination with custom colors and exporting spectrum graphics, pinning can also help you to prepare snapshots of your profile that are suitable for publication.
| Menu Location | Compound > Pin to Graph |
| Icon |
|
How do I pin one or more compounds?
-
Click the pin for the compound in the Pinned column (
 ) of the Compound Table.
Or
Click the pin next to the compound's line in the Legend (
).
Or
Select one or more compounds in the Compound Table and, in the Compound menu, click Pin to Graph.
| Menu Location | Compound > Clear > Pin |
| Icon |
|
How do I clear a pinned compound?
-
Select the compound in the Compound Table.
-
In the Compound menu, click Clear > Pin, clear the check box for the compound in the Pinned column, click the red pin next to the compound's line in the Legend, or click the X beside the compound's entry in the Legend.
Tips and Tricks
-
Pinning a compound adds it to the Profiled Compounds set, even if you have not fit the compound.
-
Pin settings are stored with the spectrum when you save it as a
.cnxfile. The compound that you pin remains pinned when you next open the file, until you clear the pins. If you want to pin a specific compound in a group of.cnxfiles, use the Batch Edit feature. -
You can export the 'pinned' status of all compounds to a file using Batch Export.
Starring compounds lets you mark them for future reference. For example, you can use this function to label compounds of interest for later analysis. Stars are saved in the spectrum file, and remain visible when you next open the file, or until you clear them.
| Menu Location | Compound > Add Star |
| Icon |
|
How do I star one or more compounds?
-
Click the grey star for the compound in the Starred column (
 ) of the Compound Table.
Or
Select one or more compounds and, in the Compound menu, click Add Star.
| Menu Location | Compound > Clear > Star |
| Icon |
|
How do I clear one or more starred compounds?
-
Select one or more compounds in the Compound Table.
-
In the Compound menu, click Clear > Star, or click the yellow star for the compound in the Starred column (
 ).
).
Tips and Tricks
-
Starring a compound adds it to the Profiled Compounds set, even if you have not fit the compound.
-
Stars are stored with the spectrum when you save it as a
.cnxfile. The compound that you star remains starred when you next open the file, until you clear the stars. If you want to star a specific compound in a group of.cnxfiles, use the Batch Edit feature. -
You can export the 'starred' status of all compounds to a file using Batch Export.
Profiler can remember which compounds are selected in the current spectrum, and re-apply this selection to compounds in other spectra. This is useful when working with other features in the Compound menu across a set of spectra, such as “Fit Automatically”.
| Menu Location | Tools > Remember Selection |
| Icon |
|
How do I select a set of compounds from my current spectrum to work with in other spectra?
-
Select one or more compounds.
-
In the Edit menu, click Remember Selection.
| Menu Location | Tools > Restore Selection |
| Icon |
|
How do I re-apply selected compounds to a new spectrum?
-
Open the spectrum that you want to select your compounds in.
-
In the Edit menu, click Restore Selection.
Tips and Tricks
-
You can use this feature to quickly select a number of known compounds in the Compound Table to be fit automatically.
When you are profiling a spectrum, you may have several compound sets active. The number of compounds appearing in the Compound Table can make it difficult to locate a particular compound to profile. Quick Searches let you temporarily limit the number of compounds appearing in the Compound Table based on search criteria. The search criteria can include text searches based on compound name, location, compound IDs, compound comments or all of these. You can also search by frequency, listing all compounds appearing at a specific frequency, or within a frequency range.
How do I limit the compounds visible in the Compound Table?
-
Locate the search box at the top right of the Compound Table or press Ctrl-L to automatically focus the search field.
Click the binoculars icon at the left edge of the search box to choose the type of search to use (Compound Name, Compound Comment, Compound ID, Location or All). If you do not specify a search type, the default is All.
-
Type your search terms in the Quick Search box. The contents of the Compound Table update to show all matches to your current entry.
-
Click the X at the right edge of the search box to cancel the search and restore the full list of compounds. Clearing the search field also resets the search type to All.
How do I search for compounds near a single or multiple frequencies using the Spectrum View?
-
Right-click on the spectrum, and click Search for Compounds Near x.xx ppm to initiate a single location search, or Add x.xx ppm to search locations to append the current location to the existing search location(s).
-
Click the X at the right edge of the search box to cancel the search and restore the full list of compounds.
How do I search for compounds in a single or multiple frequency ranges using a selected region?
-
Use the Select Region tool to select a region of the spectrum.
-
Right-click on the selected region, and click Search for Compounds in this Region or Add Region to search locations.
-
Click the X at the right edge of the search box to cancel the search and restore the full list of compounds.
Search For Compounds is an alternate method for setting up a Quick Search based on a frequency or range that you type, rather than based on clicked locations in the Spectrum View.
| Menu Location | Tools > Search For Compounds... |
| Icon |
|
How do I filter the compounds in the Compound Table based on a specific frequency or range?
-
Open the Search for Compounds dialog.
-
Enter the frequency or range that you want to use to search the Compound Table.All individual queries must start with @, and the list must be comma separated. For instance, @1.20 to 1.25, @7.21 to 7.23 would search for compounds having peaks appearing in both the 1.20 to 1.25, and 7.21 to 7.23 ppm range.
-
Click OK.
Tips and Tricks
-
Use Quick Searches to temporarily limit the number of compounds displayed. Use compound sets created in Library Manager to define a more permanent working set of compounds for profiling a particular type of spectra.
-
You can reset the Quick Search box and clear all filters at any time by pressing Esc.
-
After editing the Quick Search box, press the down arrow to navigate to the Compound Table.
-
You can click repeatedly anywhere under the sum line (red) in the Spectrum Graph to cycle through the compounds contributing to the sum line at the frequency that you clicked.
-
When you right-click anywhere under the sum line (red) in the Spectrum Graph, the resulting context menu shows a list of compounds contributing to the sum line at the frequency that you clicked. Select a compound from the list to make it the active compound.
-
You can perform frequency and frequency range searches directly from the Quick Search box. For example, type @2.89 to find compounds appearing at 2.89 ppm, or type @3.0 to 7.0 to find compounds appearing between 3.0 and 7.0 ppm.
Related Topics
When you match the shape and position of a compound signature in the software to the shape of your spectrum, you are said to be 'fitting' or 'profiling' that compound. Compounds with a peak-based fit style, such as those found in the Chenomx Reference Library, are fit by adjusting the compound height and by making adjustments (sometimes called 'transforms') to the locations of their clusters. It is also possible to create your own compounds that use a region-based fit style, which automatically fit all of the spectrum area in whatever region they are located in. For more information about fit styles, see “Compound Fit Style”.
When using peak-based compounds to profile a spectrum, you measure compound concentrations by determining the height of each compound signature that best matches the peak heights in your spectrum. When you adjust the height of a compound, the heights of all peaks and clusters corresponding to the compound scale proportionately.
The frequencies (i.e. positions) of the clusters in a compound signature may need to be adjusted during fitting, as well. These frequencies may be different from those in your spectrum due to slight mismatches in solution pH, ion concentrations, and other matrix effects. These potential errors are captured by a region around each cluster known as its 'transform window'. Profiler displays the transform window for each cluster as two triangles on the spectrum baseline when the cluster is selected. If the pH value for your spectrum has been calibrated correctly, you should be able to move each cluster to obtain a good fit without needing to move outside of the limits of the cluster's transform window.
How do I fit a compound and obtain a concentration?
-
Select a peak-based compound in the Compound Table (for example, choose any compound found in the standard Chenomx Reference Library). If you do not see any compounds in the Compound Table, select additional compound sets.
-
Click and drag the cluster to adjust the fit. You can also click and drag the blue triangle on the vertical axis of the graph to change only the compound concentration, or drag a blue triangle on the horizontal axis to change only a cluster's frequency.
-
The concentration of the compound will appear in the Concentration column in the Compound Table.
How do I fit a region-based compound?
-
Select a region-based compound in the Compound Table. If you do not see any compounds in the Compound Table, select additional compound sets. Note that there are no region-based compounds present in the default Chenomx Reference Library--you will likely need to create your own and add it to your Compound Library.
-
Click and drag the cluster to adjust the fit. Notice how changing the height of the compound has no effect on which part of the spectrum is fit.
-
Concentrations cannot be calculated for region-based compounds. Instead, the otherwise unfit spectrum areas near each cluster will be summed up and displayed in the Area column of the Compound Table. This value is proportional to the true concentration of the compound.
How do I clear the fit for one or more compounds?
-
Select one or more fit compounds in the Compound Table. If you do not see any fit compounds in the Compound Table, make sure that you have selected the Profiled Compounds set. If you still do not see any fit compounds, then the current spectrum has no compounds that have been profiled.
-
In the Compound menu, click Clear > Fit, or right-click on the compound in the Spectrum Graph or the Compound Table and click Clear > Fit.
Tips and Tricks
-
You can have Profiler suggest a fit for the currently selected compound by clicking Compound > Fit Automatically, or by pressing the space bar.
-
You can double-click on a peak-based compound's concentration in the Compound Table and type a value directly to set the concentration. Type a number from 0 to 5000 mM (or equivalent concentrations in μM or mg/dL), or type "--" to set the concentration to unknown.
-
When you have selected a compound in the Compound Table, you can click its shape in the Spectrum Graph, then use the arrow keys to adjust the compound's concentration or the cluster's position. Hold down Shift to allow finer adjustments.
-
If you do not want to accidentally move any cluster outside of its transform window, you can make Profiler strictly enforce all cluster transform windows by clicking Edit > Enforce Transform Windows.
-
You can view the size of the transform that has been applied to any cluster by hovering the mouse cursor over it. The transform size appears in the top right corner of the Spectrum Graph, and visually as a thick blue line connecting the starting position of the selected cluster and its current position.
-
When you move a cluster outside its transform window, its transform adjustment triangle turns red. The Transform column in the Compound Table will also indicate whether the compound has any clusters that have been moved beyond their transform windows
-
To clear all of the fits for the current spectrum, click Edit > Select All and then click Compound > Clear > Fit.
-
To clear fits only for selected compounds, select the compounds and click Compound > Clear > Fit. Multiple compounds can be selected by holding down Shift or Ctrl (Cmd in Mac OS X).
-
All compound concentrations and areas start out as unknown (--).
-
If a compound's concentration is unknown (--) and you drag it up and then back down to the baseline, the concentration is set to 0.00 mM. To return the concentration to unknown, you must clear it.
-
You can export a file describing the transform status of all compounds by clicking Tools > Batch Export.
Related Topics
Profiling a spectrum manually involves a lot of effort in setting initial concentrations and cluster frequencies. You can have Profiler suggest a fit for either the currently selected compound, a selection of compounds, or all compounds in the compound table. This allows you to focus your efforts on tasks like refining your overall analysis of the spectrum, or resolving overlapped compounds.
| Menu Location | Compound > Fit Automatically |
| Icon |
|
How do I fit one or more compounds automatically?
-
Select one or more compounds in the Compound Table.
-
In the Compound menu, click Fit Automatically.
How do I fit all compounds automatically?
-
In the Edit menu, click Select All, and then in the Compound menu, click Fit Automatically.
Tips and Tricks
-
The order that you fit compounds will have a bearing on the results of an automatic fit because Profiler will take the current fit into account when trying to provide an automatic fit for your selected compounds.
-
Some compounds may not be sucessfully autofit; the fit for these compounds will not be changed. Although Profiler will often arrive at acceptable values for compounds that it can fit, you should always review the results of an automatic fit before moving on to other compounds.
-
Fit Automatically yields more reliable results from properly processed spectra. This includes well-defined CSI parameters, and accurate spectrum pH values.
-
A region-based compound can always be fit automatically.
-
Use the Remember Selections feature to the mark compounds that can be reliably autofit in your project. You can then restore the selection when working on subsequent spectra, allowing you to quickly autofit those compounds.
-
You can automatically fit compounds in multiple spectra at once by using the Batch Fit tool.
Once peak clusters have been positioned, compound concentrations can be fit and optimized using constrained penalized linear least squares, according to:
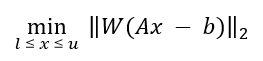
Where...
-
A is the model matrix made up the unscaled individual signatures of the compounds being fit. The current locations of the peak clusters are taken into account when the A matrix is calculated. The optimization process will not modify the location of the peak clusters.
-
x is a vector made up all of the compound concentrations to be optimized. Each component of the vector, xi, is bounded between li (lower bound) and ui (upper bound). Non-negative restraints are imposed (li ≥ 0) since concentrations cannot be negative.
-
b is the spectral subtraction line, i.e. the experimental spectrum minus the contribution of all compounds part of the current profile that are not part of the optimization process. In other words, if a compound has been fit and his not part of the fitting process, its contribution is subtracted from the experimental spectrum before the process starts.
-
W is a weight vector, which is used to modulate the relative importance of each spectral point. Optionally, the algorithm can increase the weight of the points that are overfit though an iterative penalization process.
The Concentration Fitting tool can be invoked either from the Tools menu, or from the contextual menus shown by right-clicking or control-clicking on selected compounds in Profiler’s compound table, or on a selected spectral area.
The interface is composed of three main sections: Regions Selection, Compounds Selection, and Fitting options. The role of each section is described below. The application Preferences panel can be used to control and set all the default values appearing in the interface.
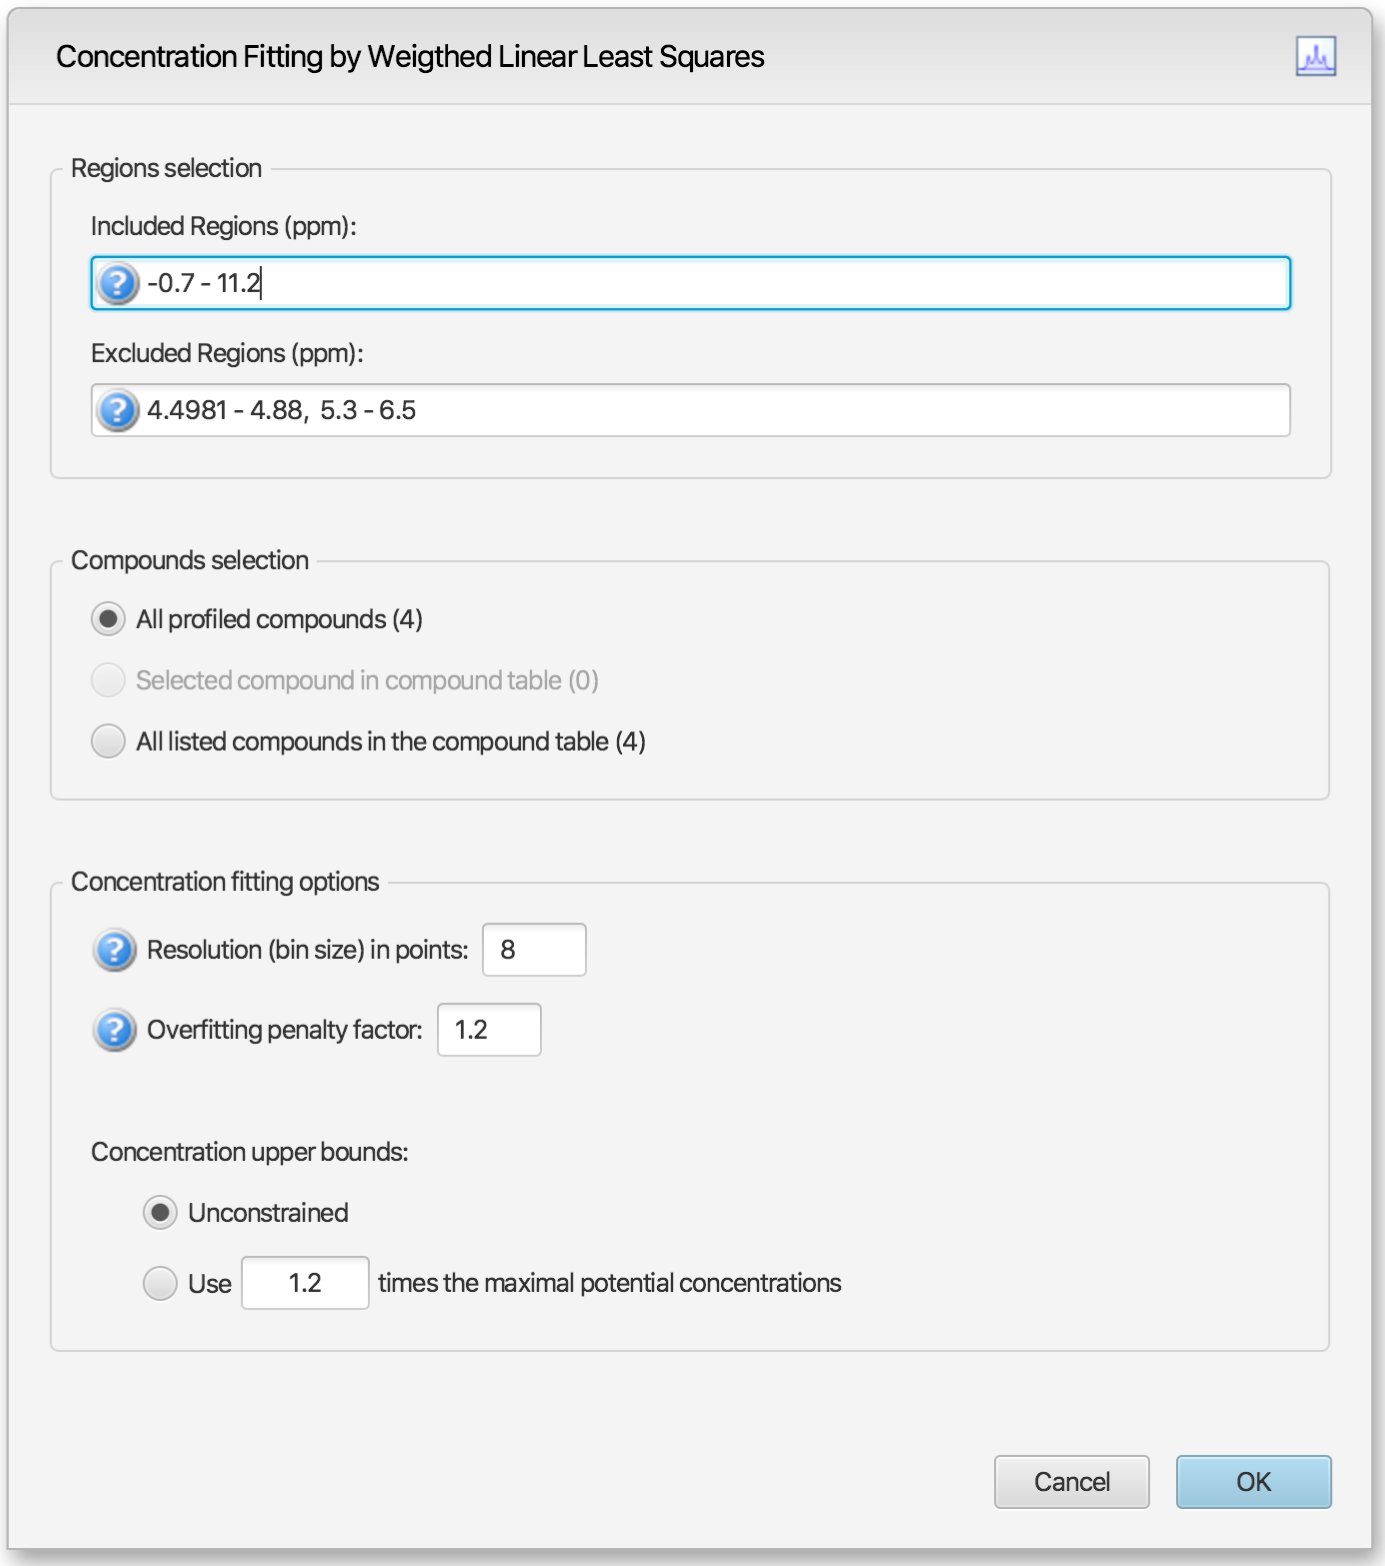 |
Regions Selection: Comma-separated list of spectral regions (in ppm units) to be included or excluded in the fit. Each component of the lists must include a lower and upper bound in ppm, separated by a dash. For instance, “0.8-2.3, 3.0-4.2” is a valid list.
The Included Regions input field displays the limits of the currently selected spectral region (as selected with the Select Region Tool). If no region is currently selected, the Included Regions input field defaults to the entire spectrum.
The Excluded Regions input field will automatically include the region associated with the water peak. It is recommended that any peaks around the water region be excluded due to attenuation caused by water saturation. Similarly, the region associated with urea (5.4-6.0 ppm) should also be excluded if urea is present.
Excluded regions have prevalence over any included regions, i.e. any spectral point falling within any of the listed excluded regions will automatically be ignored during the fit.
Compound Selections: User can optimize either all of the members of the current profile, all of the currently selected compounds in the compound table, or all of the currently listed compounds in the compound table.
Note that compounds that do not have a single peak cluster within the participating spectral regions will not be considered for the fit. Their concentrations will not be changed.
Fitting options: This group of options control the behavior of the optimization engine.
Resolution (bin size): The spectrum can be fit using either its full representation, or a binned representation of it. This parameter controls the number of spectral points per bin. Set this parameter to 1 for full resolution. However, it is highly recommended to use a binned representation if the peak cluster positions have not been optimized. Fitting at full resolution will require more memory and CPU time.
Overfitting penalty factor: The amount of overfitting can be limited by increasing the weights of the spectral points where overfitting occurs. This will effectively increase the importance of the spectral points where this occurs relative to the other ones, adding a penalty to pay for predicting points over the spectrum line. For a given spectral point, the square of the difference between the experimentally observed spectrum intensity and the predicted/calculated one will be multiplied by the factor specified in this field if the difference is negative. The weights are adjusted iteratively and up to 5 cycles of optimizations are performed if the specified penalty factor is >1.
Upper constraints: Non-negative constrained are used during the optimization process so that concentration values remain ≥ 0. Two different settings are offered to control their upper bounds. They can be set to be unlimited via the Unconstrained option, or limited according to their predetermined maximal potential concentration. The maximal potential concentration of a given compound is the highest concentration for which the compound signature would not exceed the experimental spectrum. Because of possible discrepancies between the compound library signatures and the experimental spectrum, mainly due to pH conditions, matrix effects, etc, the potential concentrations determined by Profiler may not be optimal and should only be regarded as guidelines. To give potential concentrations more wiggle room, potential concentrations can be pre-multiplied by a specified constant. The derived set of scaled potential concentration values will then be used as upper bounds.
It very important to note that the baseline is not modeled from the residuals at any stage. It is therefore crucial that the baseline be properly corrected prior to concentration fitting.
Transform windows appear alongside compound signatures to guide profiling by restricting the frequency range that you can adjust each cluster. All Chenomx Reference Compounds have had transform windows set to allow the flexibility to fit most common biofluids. You can choose to have the transform windows enforced, preventing you from moving any cluster outside its transform window, or not enforced, allowing you to move any cluster beyond its transform window.
How do I enforce transform windows?
-
On the Edit menu, check Enforce Transform Windows.
How do I allow clusters to move outside their transform windows?
-
On the Edit menu, clear Enforce Transform Windows.
Tips and Tricks
-
Clusters that are outside their transform window appear in the Transforms column of the Compound Table as Outside Windows. Note that you may need to turn on the Transforms column in the Compound Table.
-
When you move a cluster outside its transform window, the adjustment triangle on the horizontal axis of the graph turns red. Also, when you hover over the cluster of its triangle, the visual indicator for the adjustment is red, as is the text in the top right corner of the Spectrum Graph describing the extent of the adjustment.
-
Transform windows for pH sensitive compound signatures (including those found in the Chenomx Reference Library) are determined in part based on the pH uncertainty for the current spectrum. If you find that you frequently need to override the transform windows for a spectrum, user Processor to check the accuracy of its pH calibration, and consider increasing its pH uncertainty value.
Related Topics
Scale Concentrations lets you modify the concentrations of profiled compounds in the current spectrum by a common multiplication factor. You can use this to compensate for dilution effects, errors in CSI concentration or other systematic influences on compound concentrations.
| Menu Location | Compound > Scale Concentration... |
| Icon |
|
How do I scale the concentration of one or more compounds by a common factor?
-
Select one or more compounds in the Compound Table, and in the Compound menu, click Scale Concentrations...
-
Enter the multiplication factor you would like to use. To increase concentrations, use a factor greater than one. To decrease them, use a factor less than one.
-
Click OK.
How do I scale the concentrations of all compounds by a common factor?
-
In the Edit menu, click Select All, and then in the Compound menu, click Scale Concentrations...
-
Enter the multiplication factor you would like to use. To increase concentrations, use a factor greater than one. To decrease them, use a factor less than one.
-
Click OK.
Tips and Tricks
-
You cannot enter a multiplication factor that would result in a concentration higher than 5000 mM for any compound.
-
If you set the multiplication factor to zero, all of the profiled compounds are set to 0 mM.
-
Scale Concentrations does not affect compounds with unknown concentrations (--).
-
If you want to scale concentrations for a specific compound or for all of the profiled compounds in a group of
.cnxfiles, use the Batch Edit feature.
Batch Edit lets you choose a group of Chenomx spectra (.cnx), and then perform an automated profiling operation on one or more compounds in each of the chosen spectra. You can choose to add stars, pins, or colors to compounds, scale compound concentrations, or clear profiled data. After selecting an option you will get to choose the compounds that you want to affect. Once completed, you can open the .cnx spectra in Profiler to review the changes that were made.
| Menu Location | Tools > Batch Edit... |
| Icon |
|
How do I star/pin/color a set of compounds in multiple spectra at once?
-
Select Batch Edit from the Tools menu.
-
Select the spectra that you want the compounds to be edited in.
-
Choose to star, pin, color, scale the concentration of, or clear the profiled data of the compounds of interest.
-
Choose a Chenomx library or a compound set that contains the compounds of interest.
-
You will be given a list of all the compounds in the library or compound set that you selected in the previous step. Select the compounds that you want to adjust and click the right-hand arrow.
-
Click finish to add the changes to the spectra selected.
Profiler can propose the pH of the sample by analysing the position of the fit peaks clusters that are pH sensitive and report an optimized pH value that would best explain the location of each.
The pH analysis is carried on based on 3 different selection modes:
-
the cluster(s) that are specifically selected for a given compound
-
the set of compounds selected in the compound table
-
if no clusters or compounds are selected, then it analyzes the entire list of profiled compounds.
Compounds with no concentration and clusters with 0 net intensity or without pH-defined chemical shifts are ignored.
The results of the analysis of each clusters/compounds are presented in a scrollable list, with compounds in the first column, cluster ID in the second, best pH value in the third, the valid compound pH range in the fourth, and the pH sensitivity of the cluster in the last column. The sensitivity is reported as the change in ppm around ± 0.1 unit of pH around the global optimum pH that is proposed.
Only the clusters with a sensitivity of ≥ 0.001 ppm are used in the calculations and reported in the list.
The reported optimized pH is the value that minimizes the weighted amount of transforms that would need to be applied to the listed clusters to explain their current position. The listed sensitivity values are used as weights.
It is possible to change the pH of the spectrum directly in the interface. Upon pH change, the clusters transforms are automatically recalculated to preserve the initial positions of the clusters.
This feature allows for automatic positioning of peak clusters on the spectrum. It will essentially position peak clusters where their shape best match the experimental spectrum, independently of intensity.
The software already has a Fit Automatically feature and while the two share some similar concepts, they are different.
Automatic Fit works on a compound basis. The best locations of all peak clusters of a given compound are looked at, and selected based on the a common, global intensity that would maximize the concentration of that compound in the spectrum. If the position of a given cluster cannot be determined unambiguously, it is left at its ‘untransformed’ location. If the location of too many clusters cannot be determined, the autofit will stop and neither the cluster positions nor the compound concentration will be set.
Compound Snapper will not attempt to set or modify the concentration of compounds. It only focuses on optimizing peak cluster locations, individually or in group, depending on the user’s selected cluster(s) or compound(s) when the feature is called. This functionality automatically positions peak clusters on the spectrum at the location that best matches their global shape. If two or more clusters overlap within their allowed transform window, all possible combinations are analysed.
As such, this feature is powerful, and will find the proper cluster combination, as sophisticated as it may be, that matches, according to shape, a relevant spectral region.
A snapping operation can either be performed on the original spectral line, or on the subtraction line, i.e. by considering the “left-over” signal from everything that has been fit already. It can also be done on a compound selected in the compound table and whose concentration has not been set already.
To perform a snapping operation, first select one or several clusters from an individual compound, a single or several compounds at once from the compound table, right-click in your selection to bring a contextual menu, or choose Snap Compound from the Compound Menu (main toolbar).
To snap all clusters resonating in a particular spectral region at once, first select the region with the Select Region tool (main button tool bar), right-click and select “Find and Snap Peak Clusters in this Region”.
Batch Fit lets you choose a group of processed and calibrated spectra (.cnx), and then automatically fit one or more compounds in each of the chosen spectra. After selecting spectra you will get to choose the compounds that you want to have fit. Once completed, you can open the .cnx spectra in Profiler to review the changes that were made.
| Menu Location | Tools > Batch Fit... |
| Icon |
|
How do I automatically fit a set of compounds in multiple spectra at once?
-
Select Batch Fit from the Tools menu.
-
Select the spectra that you want the compounds to be profiled in.
-
Choose a spectrum, a Chenomx library, or a compound set that contains the compounds of interest.
-
You will be given a list of all the compounds in the spectrum, Chenomx library, or compound set that you selected in the previous step. All of the compounds are selected to be fit automatically. Select any compounds that you do not want to fit automatically and click the left-hand arrow to remove them from the list.
-
Click finish to fit the chosen compounds in the spectra. The changes made will be saved in the spectra that were selected to be fit automatically.
-
Review the spectra to ensure that the compounds were correctly profiled, and make any adjustments that are needed.
Tips and Tricks
-
Use this feature to profile compounds that can be reliably autofit at once.
-
When choosing a profiled spectrum for the compounds of interest, check the "use transforms from this spectrum as a starting point" box for a more precise fit. This takes into account any clusters that you have transformed manually in the profiled spectrum, and starts the auto fit in these transformed regions. By unchecking this box profiler will fit automatically with the modeled cluster positions from the pH Sensitive Chenomx Reference Compounds.
-
Although Profiler will often arrive at acceptable values, always review the results of an automatic fit before moving on to other compounds.
Related Topics