

You can export data from your profiled spectra for further analysis, bin the spectra for analysis by more traditional techniques, or create images of your spectra for use in publications and presentations.
When you have finished profiling a spectrum or set of spectra, you often need to get the resulting data into a spreadsheet or statistical analysis package. Batch Export lets you create a text file containing all of the relevant details from profiled spectra, in formats that you can easily open in software like Microsoft Excel or Umetrics SIMCA-P.
| Menu Location | Tools > Batch Export... |
| Icon |
|
How do I export data from one or more spectra?
-
Start the Batch Export wizard.
-
Select the type of data that would you like to export. You can export concentrations in various units, other profiling results like profiled areas, matched clusters and transform summaries, or annotations like stars, pins and custom colors.
-
Choose the source spectra to export, and specify a target folder and filename for the exported text file. You can specify the currently open spectrum, other individual spectrum files or one or more folders containing spectrum files as the source.
-
Choose a save location and file format. You can export as comma-separated text (.csv), as tab-separated text (.tsv), or as an excel spreadsheet (.xlsx).
-
Choose the compounds for which you would like to export data. You can use custom compound sets that you have created in Library Manager to filter the output to specific compounds, or you can export all profiled compounds in all of the spectra.
-
Choose additional data that you would like to include in the exported file. Additional data can include spectrum pH values, Chenomx compound IDs for the exported compounds, or InChI or SMILES strings for the exported compounds.
-
Choose the default layout (files in rows and compounds in columns) or transposed layout (compounds in rows, files in columns) for the output file, depending on how you intend to use the file.
Concentration Confidence Intervals
-
When exporting concentrations, the software will also export the statistical standard deviations on concentrations as a second tab in the excel workbook. Concentration confidence intervals (± values) at 90%, 95%, and 99% can be calculated by multiplying the reported standard deviations by 1.645, 1.96, and 2.576, respectively.
-
For each compound, the standard deviation of each cluster is calculated individually, by calculating a ‘local’ sum of difference of squares in the spectral region currently occupied by each cluster. The minimum value found for all clusters is reported. As such, the reported standard deviation should be considered “best-case scenario’.
-
Failure to properly correct the spectral baseline will result is larger sum of squares, and therefore larger concentration errors.
-
Confidence intervals can be used to assist in the determination of the meaningfulness of reported fit concentrations, and in the decision to include or reject compounds in statistical models.
Tips and Tricks
-
You must export Areas rather than Concentrations when working with compounds that have a region-based Fit Style (see “Compound Details”)
-
To filter the exported compounds without modifying the source spectra, create a Compound Set or Smart Compound Set in Library Manager, and only export compounds in that Compound Set.
-
Use the default layout to export files that you intend to open with statistical analysis packages. Use the transposed layout to export files that you intend to open in a spreadsheet program, or if you prefer the transposed layout.
-
If you intend to open the exported file in Microsoft Excel 2003 or earlier, limit the number of compounds to less than 253 for the Default layout, or the number of files to less than 253 for the Transposed layout, since these versions of Excel do not support large numbers of columns.
When collaborating with other people on projects, you may want to quickly compare Compound Tables while profiling. Export Compound Table creates a copy of the current compound table in a format which can be easily imported into any modern spreadsheet program.
| Menu Location | File > Export > Compound Table... |
| Icon |
|
How do I export my current compound table from this spectrum?
-
Click File > Export > Compound Table.
-
Choose a save location and file format. You can export as comma-separated text (.csv), as tab-separated text (.tsv), or as an excel spreadsheet (.xlsx).
-
Click Save.
Tips and Tricks
-
If there are blank cells, there will be corresponding blank values in the exported data (this can happen if the table contains compounds that are missing from your compound library or if you export columns that can have empty cells, like "author", "pulse sequence", or "compound comment")
-
The "Status" column will never be exported, even if it is visible in the table.
-
The Starred and Pinned columns will export as "Yes" or "No" for each cell, and the Color column will export as a hex RGB value, such as 0000FF for each cell. Cells that have no color assigned will all export as the "default" color for that cell, i.e. the color that the cells compound appears when displayed on the graph.
-
You can add/remove columns, reorder columns, or click on the header of any column to change the table sort order. The columns you chose to appear in your Compound Table will be exported, and the order of the rows and columns in the exported file will be in the same order as your Compound Table.
Related Topics
When you collaborate with other people on a project, you may have different compounds in
your library than your collaborator has in theirs. Exporting profiled compounds creates a
compound pack (.pack) containing the set of actual compound signatures
that you used to profile the project, including compounds that have been annotated with
stars, pins, or colors. You can exchange compound packs with other
users of Chenomx NMR Suite, and import new packs via Library Manager. This is one way to be
certain that you and your collaborator are always profiling spectra for that project using
exactly the same collection of compound signatures.
| Menu Location | File > Export > Profiled Compounds... |
| Icon |
|
How do I export a compound pack from the current spectrum?
-
Open the Export Profiled Compounds dialog.
-
Enter a name for the exported compound pack. The name you enter is used to label the associated Compound Set when the compound pack is imported into another library via Library Manager.
-
Click OK.
-
In the resulting file chooser, locate the folder in which you would like to save the compound pack.
-
In the File Name field, type the new name for the compound pack file. The specified name can be different from the name of the compound pack itself, but you may prefer to keep them the same.
-
Click Save.
Tips and Tricks
-
If you want to export all of the compounds in a compound set, regardless of whether they have been fit in a particular spectrum, use Export as Compound Pack in Library Manager.
Spectral profiling can be accelerated by importing, partially or entirely, profiled data of spectra that have already been fit. This is particularly efficient when dealing with large series of similar spectra.
| Menu Location | File > Import Profile... |
| Icon |
|
How do I import a profile from another spectrum?
There are 4 ways profiled data can be imported:
-
By choosing Import Profile from the File menu.
-
By selecting Batch Import Profile from the Batch Operations in the Tools menu.
-
By dragging and dropping a cnx file directly in the compound table. The file can also be chosen from Files panel that can be displayed in the left or right vertical sidebar in Profiler
-
By selecting and dragging compounds from the compound table of one opened instance of Profiler to another one.
Except for the last option, the changes are automatically applied. Any dragged compounds from another profile will automatically overwrite what may exist. The operation is cancellable by selecting Undo Import Profile from the Edit menu.
For the other first 3 options, the following interface will be presented to allow for more options:
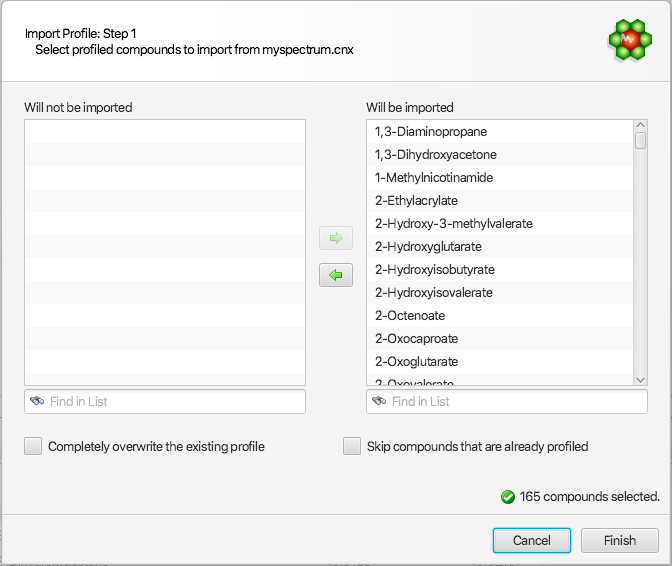
The right listbox will automatically be populated with all of the compounds that are available from the source cnx spectrum, and automatically chosen as the default set of compounds to be imported. Compounds that should not be imported can be selected and drag to the “Will not be imported” listbox on the left side of the interface. All compounds chosen for import will merge with the existing profile, and the profile of pre-existing compounds will be automatically replaced by those imported, unless the “Skip compounds that are already profiled” option is selected (see below).
Two additional options are available to control the behaviour of the import operation:
-
Completely overwrite the existing profile: This option will first completely wipe the current existing profile before the selected compounds are imported.
-
Skip compounds that are already profile: If selected, this option will ignore the import of compounds that are pre-existing
Tips and Tricks
-
When you import a profile, fully or partially, the imported data completely replaces what currently exists. That applies to peak cluster transforms, compound concentrations, and compound annotations (colors, etc).
Related Topics
| Menu Location | File > Send to Processor |
| Icon |
|
As you work with a spectrum in Profiler, you may notice that the phase correction, baseline correction or other aspects of the spectrum's lineshapes are not properly adjusted. Similarly, you may import a spectrum directly into Profiler, only to realize that it requires phase correction, baseline correction, or additional pH or CSI calibration. Send to Processor closes the current spectrum in Profiler, and opens it in Processor, retaining any changes you have made in Profiler.
Tips and Tricks
-
Any changes that you have made in Profiler are retained when you send the spectrum to Processor, and will be visible if you bring the spectrum back into Profiler. However, you still need to save the spectrum, either in Processor or Profiler, to permanently save those changes to the spectrum file.
Related Topics