

The Compound Builder module lets you create compound signatures so that
you can identify and quantify your own custom compounds.
You can add your newly created compound signatures
(.xcpd) to your compound library
by using Library Manager. Once they are in your library, these custom
compouds can be used to profile spectra in Profiler.
For a hands-on introduction to Compound Builder, see “Tutorial and Sample Files”.
|
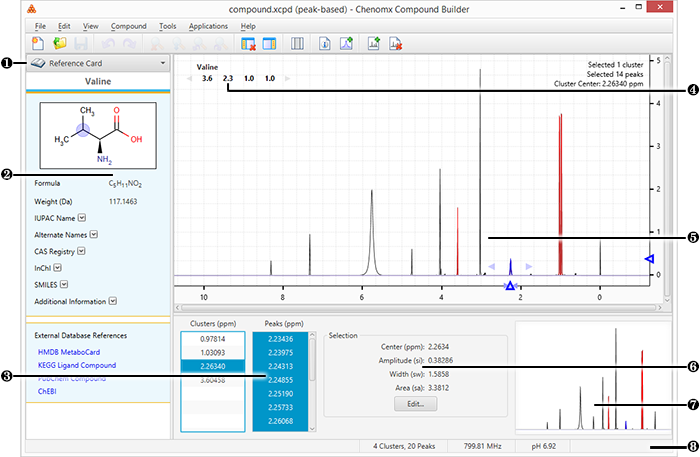
Sidebar View Dropdown Menu. Lets you change the currently visible Sidebar view. |
|
|
Reference Card Panel. Displays additional information for the compound indicated by the Chenomx Compound ID in the Compound Details, including structure, molecular weight, CAS-RN and so on. |
|
|
Cluster and Peak Lists. Let you edit, select or remove clusters or peaks in the currently open compound. Also lets you define new clusters based on the currently selected peaks or clusters. |
|
|
Cluster Navigator. Lets you navigate among the clusters of the currently open compound. You can enable or disable the Cluster Navigator using the View menu. |
|
|
Spectrum Graph. Displays the spectrum as well as the sum line and the currently selected cluster(s) or peak(s). |
|
|
Information Panel. Displays information relating to the currently selected cluster(s) and peak(s). |
|
|
Spectrum Thumbnail. Displays a thumbnail image of the Spectrum View. The thumbnail can also be used to navigate the spectrum at various zoom settings. |
|
|
Status Bar. Displays the current cursor position in the units specified by the View > X Scale and View > Y Scale settings. Also displays information about recent user actions. |