Table of Contents

  • Notices and Trademarks
  • Open this section 1. Introduction
    • Open this section 1.1. Installing Chenomx NMR Suite
      • Windows (64-bit)
      • Windows (32-bit)
      • Mac OS X
      • Linux (64-bit)
      • Linux (32-bit)
    • 1.2. Running Chenomx NMR Suite
    • 1.3. Software Updates
    • 1.4. Tutorial and Sample Files
  • Open this section 2. Handling Samples and Spectra
    • Open this section 2.1. Sample Preparation
      • Preparing Filter Tubes for Sample Filtration
      • Filtering the Sample through Microcentrifuge Filter Tube
      • Internal Standard Solution
    • Open this section 2.2. Spectral Data Acquisition
      • Pulse Sequences
      • Required NMR Parameters
    • Open this section 2.3. Spectral Data Processing
      • Data Processed with Other Software
  • Open this section 3. Common Tasks
    • 3.1. Processing a Spectrum
    • 3.2. Profiling a Spectrum
    • 3.3. Identifying Compounds
    • 3.4. Profiling Overlapped Regions in a Spectrum
    • 3.5. Determining Compound Concentrations
  • Open this section 4. The Basics
    • 4.1. Opening Files
    • 4.2. Importing Spectra
    • 4.3. Saving Files
    • 4.4. Closing Files
    • 4.5. Exiting Modules
    • 4.6. Undo and Redo
    • 4.7. Change Columns
    • Open this section 4.8. Sidebar
      • Legend
      • Files
      • Reference Cards
      • Spectrum Details
      • Processing History
      • Compound Sets
      • Simulation
    • 4.9. Spectrum Overlays
    • Open this section 4.10. Spectrum Graph Tools
      • Show Entire Spectrum
      • Set Zoom
      • Undo/Redo Zoom
      • Auto Zoom
      • Increase/Decrease Vertical Zoom
      • Increase/Decrease Horizontal Zoom
      • Spectrum Graph
      • Spectrum Thumbnail
      • Select Region
    • 4.11. Export Spectrum Image
    • 4.12. Copy Spectrum Image to Clipboard
    • 4.13. Display Options
    • 4.14. Preferences
  • Open this section 5. Processor
    • 5.1. Overview
    • Open this section 5.2. Processing Tools
      • Line Broadening
      • Phase Correction
      • Baseline Correction
      • Shim Correction
      • Region Deletion
      • Reverse Spectrum
      • Batch Process
    • Open this section 5.3. Calibration Tools
      • Calibrate CSI
      • Define Custom CSI
      • Calibrate pH
      • Calibration Tool
    • Open this section 5.4. Information Tools
      • Spectrum Details (Sidebar)
      • Processing History (Sidebar)
    • Open this section 5.5. Importing and Exporting Data
      • Batch Import
      • Send to Profiler
      • Export as JCAMP-DX
  • Open this section 6. Profiler
    • 6.1. Overview
    • Open this section 6.2. Profiling Tools
      • Compound Table
      • Custom Colors
      • Pinned Compounds
      • Starred Compounds
      • Remember Selection
      • Quick Searches
      • Concentrations and Compound Fits
      • Fit Automatically
      • Concentration Fitting and Optimization Tool
      • Enforce Transform Windows
      • Scale Concentrations
      • Batch Edit
      • pH Tool
      • Compound Snapper
      • Batch Fit
    • 6.3. Cluster Navigator
    • Open this section 6.4. Compound Set Tools
      • Compound Sets (Sidebar)
    • Open this section 6.5. Importing and Exporting Data
      • Batch Export
      • Export Compound Table
      • Export Profiled Compounds
      • Import Profile
      • Send to Processor
    • 6.6. Spectral Binning
    • Open this section 6.7. Information Tools
      • Legend (Sidebar)
      • Reference Card Panel (Sidebar)
      • Spectrum Details (Sidebar)
      • Concentration Units
  • Open this section 7. Spin Simulator
    • 7.1. Overview
    • Open this section 7.2. Simulating Tools
      • New Simulation
      • Spin Systems
      • Spin Definitions
      • Spin Navigator
      • J-Modifiers
    • Open this section 7.3. Information Tools
      • Spin Definition (Sidebar)
      • Simulation Details
  • Open this section 8. Compound Builder
    • 8.1. Overview
    • Open this section 8.2. Building Tools
      • New Compound
      • Import Simulation
      • Adding Peaks
      • Selecting Peaks and Clusters
      • Delete Selected Peaks
      • Adjusting Peaks
      • Grouping Peaks as a Cluster
      • Optimize Selected Peak Shapes
      • Generate Cluster for Region
      • Transform Windows
      • pH Sensitivities
      • Manage Cluster IDs
      • Cluster Navigator
    • Open this section 8.3. Information Tools
      • Reference Card Panel (Sidebar)
      • Compound Details
      • Information Panel
    • 8.4. Compound Fit Style
  • Open this section 9. Library Manager
    • 9.1. Overview
    • Open this section 9.2. Library Tools
      • Compound Table
      • Quick Searches
      • Add Compounds
      • Export Compounds
      • Send to Compound Builder
      • Remove Compounds
      • Update Compounds
    • Open this section 9.3. Compound Set Tools
      • Compound Sets (Sidebar)
      • Automatic Compound Sets
      • Compound Sets
      • Smart Compound Sets
      • Rename Compound Sets
      • Remove Compound Sets
    • Open this section 9.4. Reference Card Editor
      • Required Details
      • Optional Details
    • Open this section 9.5. Information Tools
      • Reference Card Panel (Sidebar)
Chenomx NMR Suite User Guide logo

Search Results (close)

This is where the search results appear

Chapter 5. Processor

The Processor module lets you import spectra into the Chenomx NMR Suite format (.cnx) and then perform standard processing and calibration operations. Spectral data can be imported from many third-party vendors and software packages, including Agilent, Bruker, JEOL, JCAMP-DX, Mnova, and NMRPipe.

For a hands-on introduction to Processor, see “Tutorial and Sample Files”.

5.1 Overview

Image of the Processor main window

❶

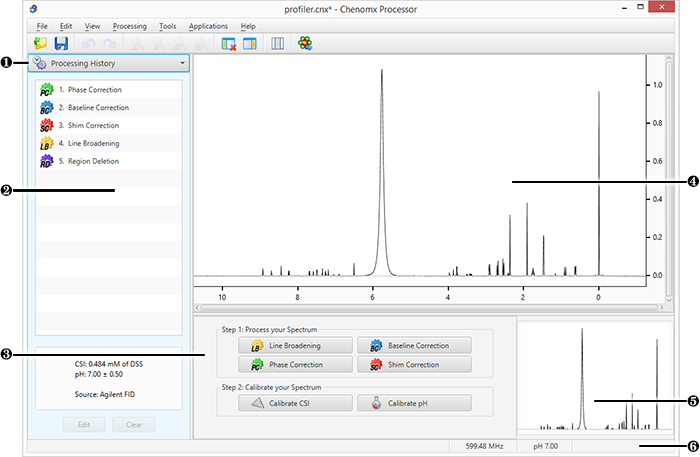
Sidebar View Dropdown Menu. Lets you change the currently visible Sidebar view.

❷

Processing History. Displays a list of every processing layer that you have applied to the current spectrum, and lets you remove any processing layer that you have applied using the Processor module. Also displays information relating to the selected processing layer.

❸

Processor Dashboard. Contains quick-access buttons for the most commonly used processing features and calibration tools.

❹

Spectrum Graph. Displays the spectrum as well as guidelines used during pH determination, CSI adjustments and other processing steps.

❺

Spectrum Thumbnail. Displays a thumbnail image of the current spectrum. You can also use the thumbnail to navigate the spectrum at various zoom settings.

❻

Status Bar. Displays the current cursor position in the units specified by the View > X Scale and View > Y Scale settings. Also displays information about recent user actions.


Prev Next
4.14 Preferences Home 5.2 Processing Tools
© 2021 Chenomx Inc.

Last modified: 30 Jun 2021