

The Profiler module helps you to identify and quantify compounds in a sample spectrum, as well as apply spectral analysis techniques like spectral binning. You can fit any available compound to the current spectrum, and narrow down the compounds you're interested in by using compound sets and filters.
For a hands-on introduction to Profiler, see “Tutorial and Sample Files”.
|
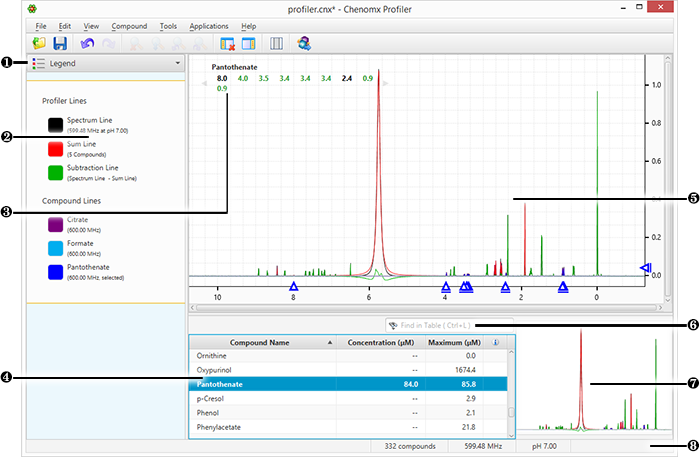
Sidebar View Dropdown Menu. Lets you change the currently visible Sidebar view. |
|
|
Legend. A sidebar view letting you customize the lines appearing in the Spectrum View. |
|
|
Cluster Navigator. Lets you navigate among the clusters of the currently selected compound. You can enable or disable the Cluster Navigator using the View menu. |
|
|
Compound Table. Displays compounds, their calculated concentrations, and their profiling status. You can access signatures of these compounds in the Spectrum Graph by selecting them. As well, you can view additional compound information in the Reference Panel by selecting a compound in the Compound Table and switching the sidebar view to the Reference Card Panel. You can change the default concentration units displayed in the Compound Table using the View menu. |
|
|
Spectrum Graph. Displays the spectrum as well as the sum line and subtraction line. You can modify the display by focusing in on a particular area or displaying and modifying compound signatures. |
|
|
Quick Search. Lets you filter the Compound Table to focus on a particular compound or group of compounds. |
|
|
Spectrum Thumbnail. Displays a thumbnail image of the current spectrum. You can also use the thumbnail to navigate the Spectrum Graph at various zoom settings. |
|
|
Status Bar. Displays the current cursor position in the units specified by the View > X Scale and View > Y Scale settings. Also displays information about recent user actions. |