Table of Contents

  • Open this section 1. Notices and Trademarks
    • 1.1. Technical Support
    • 1.2. Disclaimer of Warranties and Liabilities
    • 1.3. Trademarks
  • Open this section 2. Introduction
    • 2.1. Running Chenomx NMR Suite
    • 2.2. Software Updates
    • 2.3. Tutorial and Sample Files
  • Open this section 3. Handling Samples and Spectra
    • Open this section 3.1. Sample Preparation
      • Preparing Filter Tubes for Sample Filtration
      • Filtering the Sample through Microcentrifuge Filter Tube
      • Internal Standard Solution
    • Open this section 3.2. Spectral Data Acquisition
      • Pulse Sequences
      • Required NMR Parameters
    • Open this section 3.3. Spectral Data Processing
      • Data Processed with Other Software
  • Open this section 4. Processor
    • 4.1. Overview
    • Open this section 4.2. Information Tools
      • Spectrum Details (Sidebar)
      • Processing History (Sidebar)
      • Calibration Tool
    • Open this section 4.3. Processing Steps
      • First Step: Line Broadening
      • Second Step: Phase Correction
      • Third Step: Baseline Correction
      • Fourth Step: Shim Correction
      • Fifth Step: Calibrate CSI
      • Sixth Step: Send to Profiler
    • Open this section 4.4. Optional Steps
      • Region Deletion
      • Reverse Spectrum
      • Define Custom CSI
      • Calibrate pH
      • Export as JCAMP-DX
  • Open this section 5. Profiler
    • 5.1. Overview
    • Open this section 5.2. Profiling Tools
      • Compound Table
      • Cluster Navigator
      • Enforce Transform Windows
      • Scale Concentrations
      • pH Tool
      • Colors/Stars/Pins/Remember Selection
    • Open this section 5.3. Manual Profiling
      • First Step: Identify Compounds
      • Second Step: Determine Compound Concentrations
      • Third Step: Profile Overlapped Regions in a Spectrum
    • Open this section 5.4. Automatic Profiling using a semi-automated approach
      • First Step: Cluster positioning using Compound Snapper
      • Second Step: Concentration optimization using Fit Concentrations
      • COMPLETE Autofit: fully automated profiling approach
    • Open this section 5.5. Importing and Exporting Data
      • Import Profile
      • Export Profiled Compounds
      • Export Compound Table
      • Batch Export
      • Send to Processor
  • Open this section 6. Library Manager
    • 6.1. Overview
    • Open this section 6.2. Library Tools
      • Compound Table
      • Quick Searches
      • Add Compounds
      • Export Compounds
      • Send to Compound Builder
      • Remove Compounds
      • Update Compounds
    • Open this section 6.3. Compound Set Tools
      • Compound Sets (Sidebar)
      • Automatic Compound Sets
      • Compound Sets
      • Smart Compound Sets
      • Rename Compound Sets
      • Remove Compound Sets
    • Open this section 6.4. Reference Card Editor
      • Required Details
      • Optional Details
    • Open this section 6.5. Information Tools
      • Reference Card Panel (Sidebar)
  • Open this section 7. Batching and Binning (PRO Only)
    • Open this section 7.1. Batching
      • Batch Import
      • Batch Process
      • Batch Edit
      • Batch Fit
    • 7.2. Spectral Binning
  • Open this section 8. Compound Builder (PRO Only)
    • 8.1. Overview
    • Open this section 8.2. Information Tools
      • Compound Details
      • Information Panel
      • Cluster Navigator
    • Open this section 8.3. Build a Compound
      • First Step: Sample Preparation and NMR Acquisition
      • Second Step: Process your Spectrum in Processor
      • Third Step: Import new CNX file into Compound Builder.
      • Fourth Step: Add Peaks, Define Clusters and Optimize Shapes
      • Fifth Step: Set Transform Windows
    • Open this section 8.4. Optional Steps
      • Compound Fit Style
      • Import Simulation
      • Generate Cluster for Region
      • New Compound
      • Manage Cluster IDs
      • pH Sensitivities
  • Open this section 9. Spin Simulator
    • 9.1. Overview
    • Open this section 9.2. Simulating Tools
      • New Simulation
      • Spin Systems
      • Spin Definitions
      • Spin Navigator
      • J-Modifiers
    • Open this section 9.3. Information Tools
      • Spin Definition (Sidebar)
      • Simulation Details
  • Open this section 10. The Basics
    • Open this section 10.1. File Management
      • Open Files
      • Importing Spectra
      • Saving Files
      • Closing Files
      • Undo and Redo
    • Open this section 10.2. Preferences
      • Change Columns
      • Display Options
    • Open this section 10.3. Sidebar
      • Legend
      • Files
      • Reference Cards
      • Quick Searches
      • Spectrum Details
      • Processing History
      • Compound Sets
      • Simulation
    • Open this section 10.4. Spectrum Graph
      • Spectrum Thumbnail
      • Select Region
      • Spectrum Overlays
      • Zoom Tools
      • Export Spectrum Image
      • Copy Spectrum Image to Clipboard
Chenomx NMR Suite User Guide logo

Search Results (close)

This is where the search results appear

Chapter 5. Profiler

The Profiler module helps you to identify and quantify compounds in a sample spectrum, as well as apply spectral analysis techniques like spectral binning (PRO Only). You can fit any available compound to the current spectrum, and narrow down the compounds you're interested in by using compound sets and filters.

For a hands-on introduction to Profiler, see “Tutorial and Sample Files”.

5.1 Overview

Image of the Profiler main window

❶

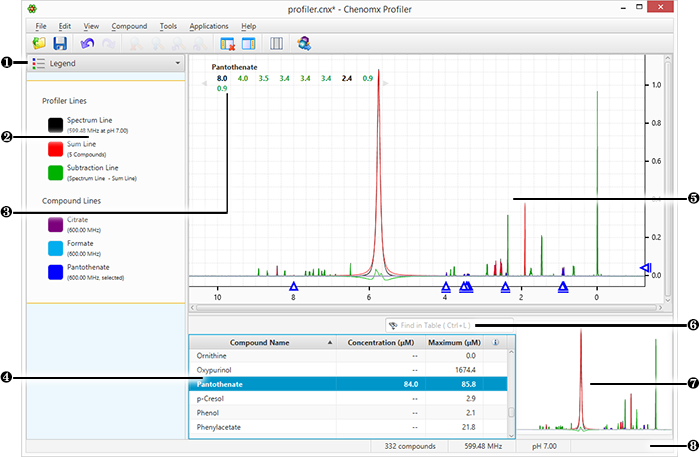
Sidebar View Dropdown Menu changes the currently visible Sidebar view.

❷

Legend customizes the lines appearing in the Spectrum View.

❸

Cluster Navigator navigates among the clusters of the currently selected compound. Enable or disable Cluster Navigator using the View menu.

❹

Compound Table displays compounds, their calculated concentrations, and their profiling status. Access compound signatures in the Spectrum Graph by selecting them. As well, you can view additional compound information in the Reference Panel by selecting a compound in the Compound Table and switching the sidebar view to the Reference Card Panel. You can change the default concentration units displayed in the Compound Table using the View menu.

❺

Spectrum Graph displays the spectrum as well as the sum line and subtraction line. Modify the display by focusing in on a particular area or display and modify compound signatures.

❻

Quick Search filers the Compound Table to locate particular compounds or groups of compounds.

❼

Spectrum Thumbnail displays a thumbnail image of the current spectrum. You can also use the thumbnail to navigate the Spectrum Graph at various zoom settings.

❽

Status Bar displays the current cursor position in the units specified by the View > X Scale and View > Y Scale settings. Also displays information about recent user actions.

Compound Signatures with a peak-based fit style, such as those found in the Chenomx Reference Library, are fit to your spectrum by adjusting the compound height and making adjustments (sometimes called 'transforms') to the locations of their clusters. The result is a 'fit', or 'profiled' spectrum.

Peak-based compound signatures profile a spectrum by measuring compound concentrations by the height of each compound signature within the peak heights of your spectrum. When the height of a compound signature is adjusted, the corresponding heights of all peaks and clusters to that compound are modified.

The frequencies (i.e. positions) of the clusters in a compound signature may need to be adjusted during fitting due to slight mismatches in solution pH, ion concentrations, and other matrix effects. These potential errors are captured by a region around each cluster known as its 'transform window'. Profiler displays the transform window for each cluster as two triangles on the spectrum baseline when the cluster is selected. If the pH value for your spectrum has been calibrated correctly, you should be able to move each cluster to obtain a good fit without needing to move outside of the limits of the cluster's transform window.


Prev Next
4.4 Optional Steps Home 5.2 Profiling Tools
© 2023 Chenomx Inc.

Last modified: 27 Jun 2023