Table of Contents

  • Open this section 1. Notices and Trademarks
    • 1.1. Technical Support
    • 1.2. Disclaimer of Warranties and Liabilities
    • 1.3. Trademarks
  • Open this section 2. Introduction
    • 2.1. Running Chenomx NMR Suite
    • 2.2. Software Updates
    • 2.3. Tutorial and Sample Files
  • Open this section 3. Handling Samples and Spectra
    • Open this section 3.1. Sample Preparation
      • Preparing Filter Tubes for Sample Filtration
      • Filtering the Sample through Microcentrifuge Filter Tube
      • Internal Standard Solution
    • Open this section 3.2. Spectral Data Acquisition
      • Pulse Sequences
      • Required NMR Parameters
    • Open this section 3.3. Spectral Data Processing
      • Data Processed with Other Software
  • Open this section 4. Processor
    • 4.1. Overview
    • Open this section 4.2. Information Tools
      • Spectrum Details (Sidebar)
      • Processing History (Sidebar)
      • Calibration Tool
    • Open this section 4.3. Processing Steps
      • First Step: Line Broadening
      • Second Step: Phase Correction
      • Third Step: Baseline Correction
      • Fourth Step: Shim Correction
      • Fifth Step: Calibrate CSI
      • Sixth Step: Send to Profiler
    • Open this section 4.4. Optional Steps
      • Region Deletion
      • Reverse Spectrum
      • Define Custom CSI
      • Calibrate pH
      • Export as JCAMP-DX
  • Open this section 5. Profiler
    • 5.1. Overview
    • Open this section 5.2. Profiling Tools
      • Compound Table
      • Cluster Navigator
      • Enforce Transform Windows
      • Scale Concentrations
      • pH Tool
      • Colors/Stars/Pins/Remember Selection
    • Open this section 5.3. Manual Profiling
      • First Step: Identify Compounds
      • Second Step: Determine Compound Concentrations
      • Third Step: Profile Overlapped Regions in a Spectrum
    • Open this section 5.4. Advanced controls
      • Minimal transform windows
      • Manual locking of concentrations
      • Manual locking of peak clusters positions
      • Custom calibration of peak cluster centers ranges for automated procedures
    • Open this section 5.5. Automatic Profiling using a semi-automated approach
      • First Step: Cluster positioning using Compound Snapper
      • Second Step: Concentration optimization using Fit Concentrations
    • Open this section 5.6. COMPLETE Autofit: fully automated profiling approach
      • How to use COMPLETE AUTOFIT
      • Tips and Limitations of COMPLETE Autofit
      • Note about Legacy Autofit
    • Open this section 5.7. Importing and Exporting Data
      • Import Profile
      • Export Profiled Compounds
      • Export Compound Table
      • Batch Export
      • Send to Processor
  • Open this section 6. Library Manager
    • 6.1. Overview
    • Open this section 6.2. Library Tools
      • Compound Table
      • Quick Searches
      • Add Compounds
      • Export Compounds
      • Send to Compound Builder
      • Remove Compounds
      • Update Compounds
    • Open this section 6.3. Compound Set Tools
      • Compound Sets (Sidebar)
      • Automatic Compound Sets
      • Compound Sets
      • Smart Compound Sets
      • Rename Compound Sets
      • Remove Compound Sets
    • Open this section 6.4. Reference Card Editor
      • Required Details
      • Optional Details
    • Open this section 6.5. Information Tools
      • Reference Card Panel (Sidebar)
  • Open this section 7. Batching and Binning (PRO Only)
    • Open this section 7.1. Batching
      • Batch Import
      • Batch Process
      • Batch Edit
      • Batch Fit
      • Batch Operations on Selected Compounds or Clusters
      • Batch Spectral Alignment
    • 7.2. Spectral Binning
  • Open this section 8. Compound Builder (PRO Only)
    • 8.1. Overview
    • Open this section 8.2. Information Tools
      • Compound Details
      • Information Panel
      • Cluster Navigator
    • Open this section 8.3. Build a Compound
      • First Step: Sample Preparation and NMR Acquisition
      • Second Step: Process your Spectrum in Processor
      • Third Step: Import new CNX file into Compound Builder.
      • Fourth Step: Add Peaks, Define Clusters and Optimize Shapes
      • Fifth Step: Set Transform Windows
    • Open this section 8.4. Optional Steps
      • Compound Fit Style
      • Import Simulation
      • Generate Cluster for Region
      • New Compound
      • Manage Cluster IDs
      • pH Sensitivities
  • Open this section 9. Spin Simulator
    • 9.1. Overview
    • Open this section 9.2. Simulating Tools
      • New Simulation
      • Spin Systems
      • Spin Definitions
      • Spin Navigator
      • J-Modifiers
    • Open this section 9.3. Information Tools
      • Spin Definition (Sidebar)
      • Simulation Details
  • Open this section 10. The Basics
    • Open this section 10.1. File Management
      • Open Files
      • Importing Spectra
      • Saving Files
      • Closing Files
      • Undo and Redo
    • Open this section 10.2. Preferences
      • Change Columns
      • Display Options
    • Open this section 10.3. Sidebar
      • Legend
      • Files
      • Reference Cards
      • Quick Searches
      • Spectrum Details
      • Processing History
      • Compound Sets
      • Simulation
    • Open this section 10.4. Spectrum Graph
      • Spectrum Thumbnail
      • Select Region
      • Spectrum Overlays
      • Zoom Tools
      • Saving and recalling view settings
      • Export Spectrum Image
      • Copy Spectrum Image to Clipboard
Chenomx NMR Suite User Guide logo

Search Results (close)

This is where the search results appear

5.4 Advanced controls

New functionalities were introduced in version 12.0, providing the user with much finer control and customization of key features, specifically with the capability of locking clusters and concentration values in place, as well as the possiblity of providing custom calibrations for cluster center limits.

Details are provided in the sections below.

Minimal transform windows

By default, the minimal transform windows on each side of peak cluster is set to 0.02 ppm, even if the pH equations predict a smaller value. It was put in place to account for possible matrix effects with some biological samples, among other things.

You can change this value in the software Preferences under the General tab. Modifying this value affects all clusters and has consequences on the capacity of the software to automatically position clusters. Contrary to manual peak positioning where going outside the calibrated transform window is allowed, calibrated transform windows are strictly respected during automated procedures, unless instructed to do so with a external custom calibration file (see below).

Manual locking of concentrations

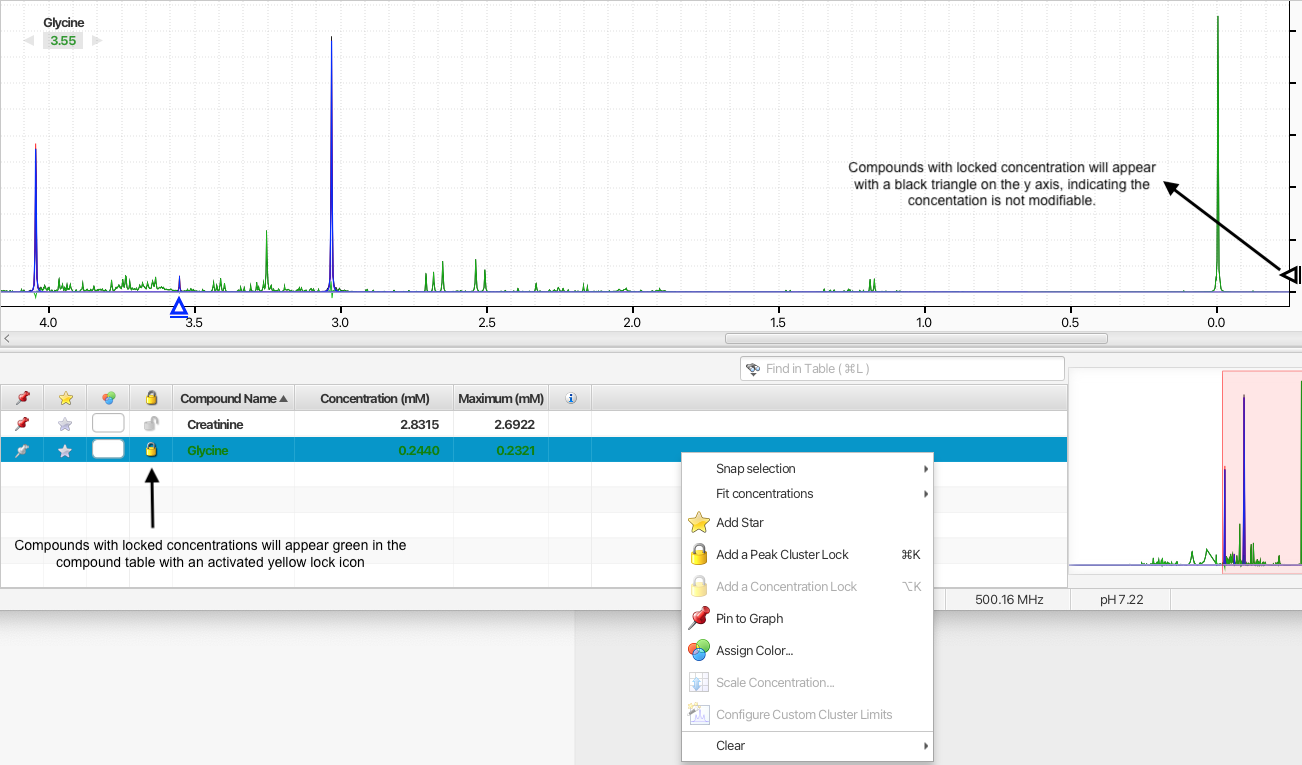
Compound concentrations can be locked so that their values cannot be changed by automated procedures or accidently by manual manipulations. Compounds will locked concentrations will appear green in Profiler's compound table.

You can activate the display of the lock statusus of compounds by right-clicking in one of the table column and selecting "Concentration locks". A column with a lock icon will appear. Clicking the lock icon will toggle the lock status on/off.

Alternatively, you cam choose to add or clear concentration locks on one or more compounds at once by first selecting the compounds in the compoudn table and then right-clicking on one of the compound's associated rows in the and choosing the appropirate otion. You can also directly add or clear concentration locks using keyboard shutcuts.

You can add or clear concentration locks to a whole series of spectra automatically via Tools Menu > Batch Operations > Batch Edit. (Pro version only)

Compound with locked concentrations will appear with a black triangle on the y axis. The triangle will not be movable until the concentration is unlocked.

Manual locking of peak clusters positions

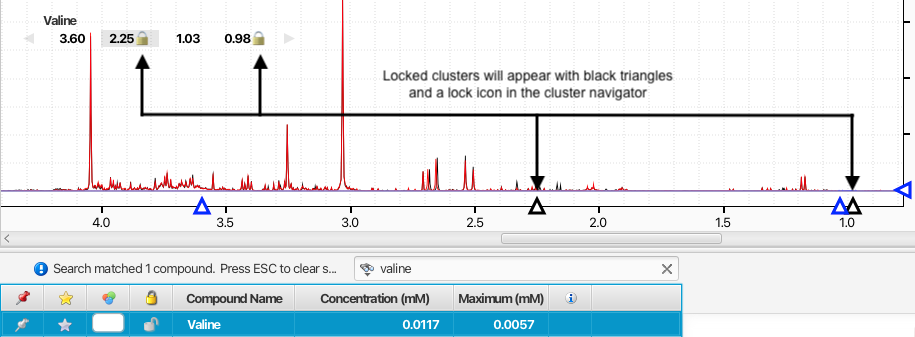
The positions of peak clusters can be locked in place so that their positions will not be modified by automated procedures or accidently by manual manipulations. Locked clusters will appear with a lock icon in the compound Cluster Navigator when the compound is selected.

You can toogle on and off the lock status of a cluster by holding on the command (Macintosh) or alt key (Windows and Linux) while double-clicking on its displayed location in ppm in the Cluster Navigator. Alternatively, you can select a compound and one or more of its clusters from the triangles displayed on the ppm axis, and right-clicking on one of them, or directly via the associated keyboard shutcuts.

Locked clusters will appear with a black triangle on the ppm axis and they will not be movable until they are unlocked.

Custom calibration of peak cluster centers ranges for automated procedures

For the batch snapping, Legacy Autofit and the COMPLETE Autofit procedures, you can optionally overwrite the automatically calibrated peak cluster transform windows with your own set of custom values. They must be provided to the autopmatic routines via a tab-seperated value (tsv) file.

To define custom cluster limits values for a given cluster, activate the cluster from its associated triangle on the x axis, right-click and select Configure Custom Cluster Limits.

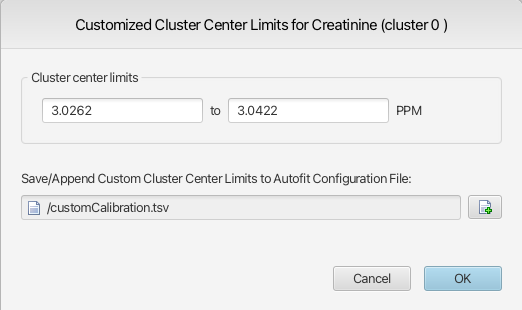
Provide custom values for the lower and upper cluster center limits, as well as a new or existing file to which the cluster information will be saved. By default, the values presented in the interface are the calibrated limits of the cluster center for the selected cluster in the currently opened spectrum if no spectral region has been selected prior to calling the function. On the other hand, if a region was selected, the limits of the selected spectral region will be shown. The default selected file will always be the last one used, allowing for fast additions to a growing file.


Prev Up Next
5.3 Manual Profiling Home 5.5 Automatic Profiling using a semi-automated approach
© 2024 Chenomx Inc.

Last modified: 05 Dec 2024